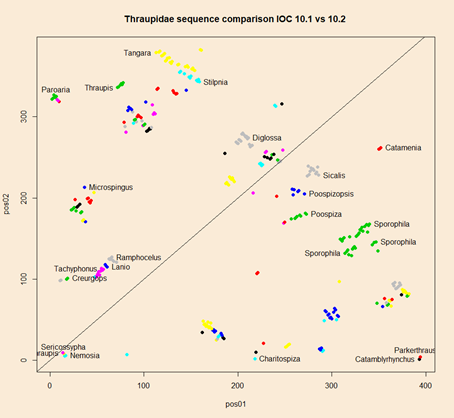
I labelled various genera/point-groupings.
For each species an x,y pair is created with the x - the sequence number of the taxon in the IOC world bird checklist version 10.1 (labelled “pos01”); the y value is the sequence number in version 10.2 (“pos02”).
Thus, in version 10.1 the first taxon is Orchesticus abeillei while in 10.2 this species is third so its corresponding point is plotted at (1,3). In contrast, in 10.1 Parkerethraustis humeralis is the 394th species in the list; in 10.2 it is the fourth species in the sequence giving (394,4).
Obviously if no changes in sequence occurred the points would lie along the diagonal identity line.
Each genus has a single color – the colors are assigned by an algorithm in the plotting routine and there are so many genera that the color list is cycled through multiple times. Each genus has a single color, but the colors are not unique to a particular genus.
I labelled various genera/point-groupings.
Points, or clusters of points that moved earlier in the sequence are below the identity line, those that moved later in sequence are above.
If a genus cluster maintains largely the same within-genus sequence but is moved within the Thraupidae, it will be a diagonal group of points parallel to the identity line but moved above or below it. An example is Poospiza.
In contrast the genus Tangara has moved within Thraupidae, and the sequence of species within the genus is largely reversed.
What does it all mean?
In contrast, this similar plot shows the change across 9 years (2009-2018) for the generally accepted sequence of Tyrannidae.
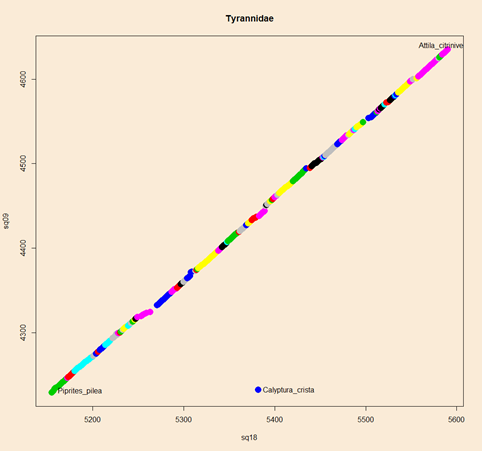
In this case the only substantial change was moving Calyptura cristata from the Cotingidae to the Tyrranidae.
We can, I believe, expect extensive revisions soon in this group.
Comments & Suggestions to Data Steward  :
: